
Kalish Shiferaw
Open to work Dallas Texas, USA

Kalish Shiferaw builds the pipeline, the warehouse, and the dashboard on top of it.

Data Analyst Business Intelligence Analyst Power BI Developer

I work with Power BI, SQL Server, DAX, SSIS, SSRS, and data modeling to transform financial, mortgage, and e-commerce data into clear, actionable reports.

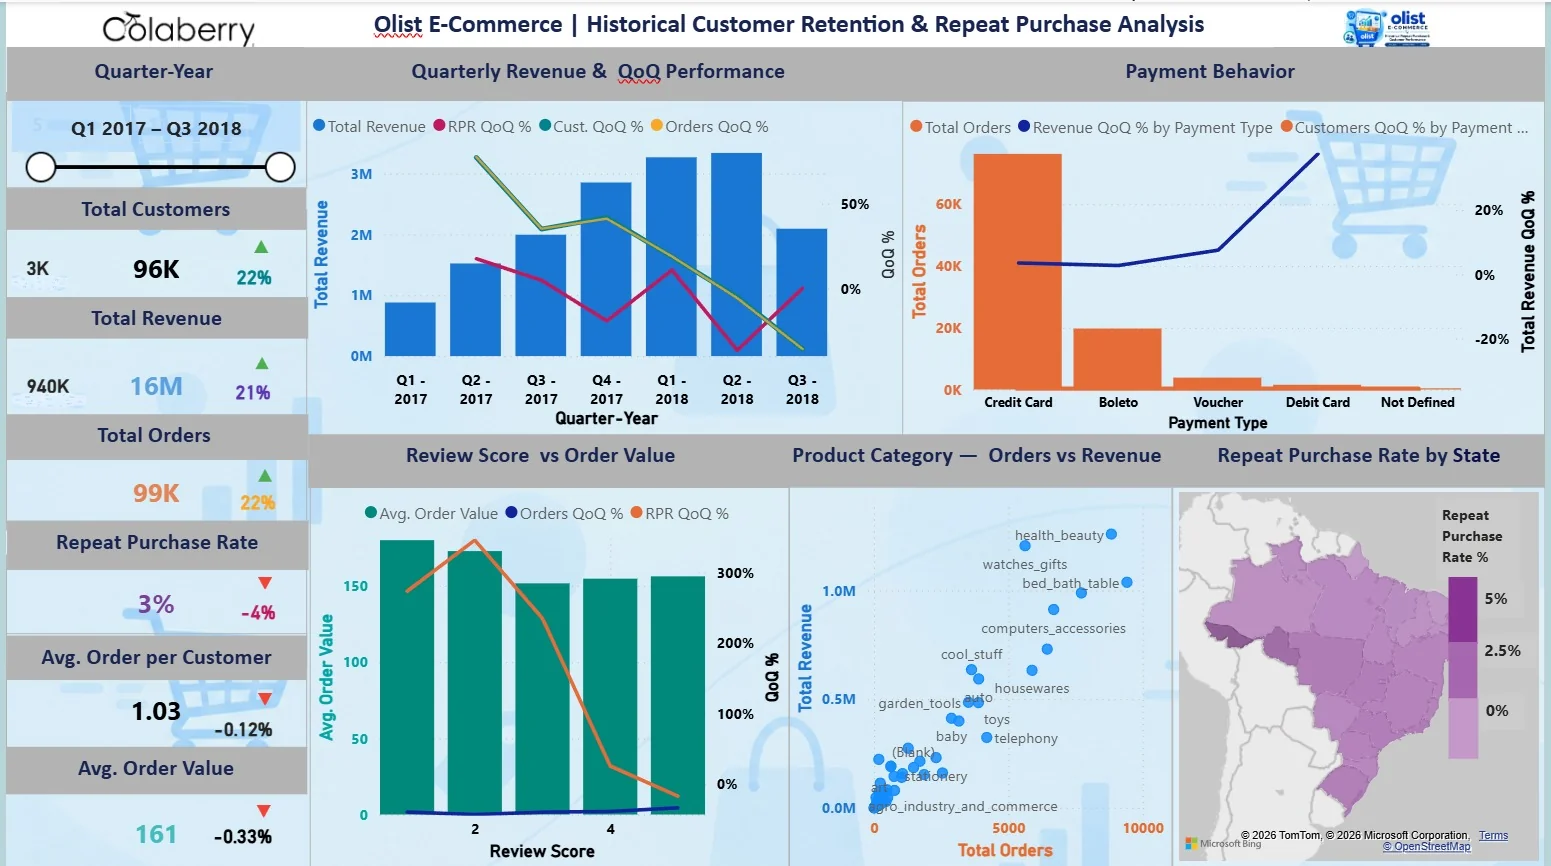
Olist retention report, filtered live in Power BI
  • Data Analytics
    Data Analytics
  • Power BI
    Power BI

Selected projects

Two projects that cover both halves of the job: getting data into shape, and showing it clearly.

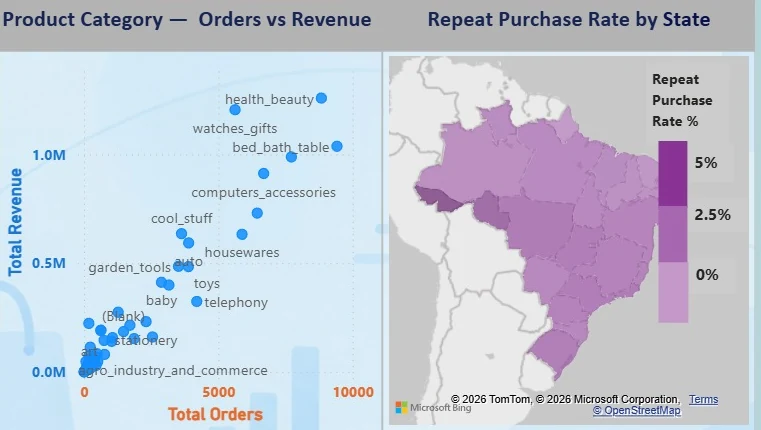
Olist Power BI dashboard with KPI column on the left and five charts: quarterly revenue with quarter-over-quarter lines, payment behavior, review score versus order value, product category scatter, and repeat purchase rate by Brazilian state.

Olist customer retention and repeat purchase analysis

Power BI DAX Data Modeling

Who comes back after a first order? This report follows revenue, orders, customers and repeat purchase rate quarter by quarter from Q1 2017 to Q3 2018, and slices them by payment type, review score, product category and Brazilian state.

Customers
96K
Orders
99K
Revenue
16M
Repeat purchase rate
3%

Full period shown in the report, Q1 2017 to Q3 2018.

Challenge

Turning a complex e-commerce dataset into reliable historical customer-retention insights while avoiding the use of predicted values as actual results.

Solution

Built a connected data model and DAX measures for repeat purchases, retention, revenue, and QoQ trends, then validated the results through a dedicated validation page.
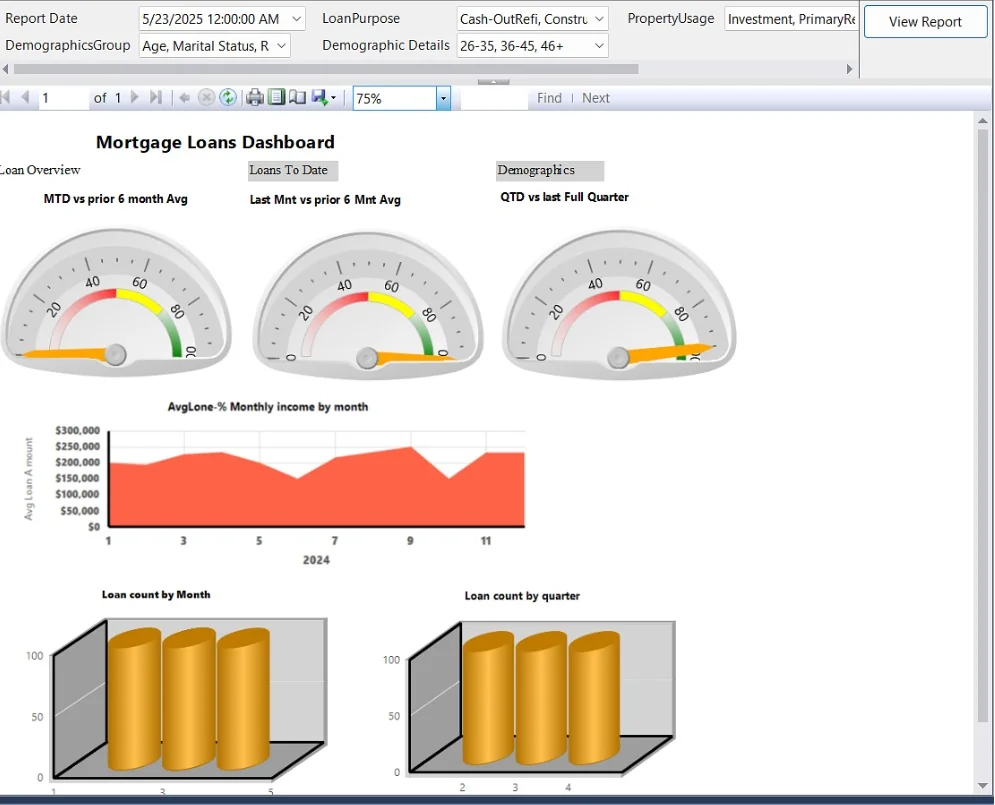
SSRS Mortgage Loans Dashboard with filters for loan purpose, property usage and demographics, three gauges comparing month, last month and quarter to earlier periods, an area chart of average loan amount by month in 2024, and loan count by month and quarter.

Mortgage loan analytics: warehouse, ETL and reports

SQL Server SSIS SSRS Power BI Data Modeling

A data warehouse for mortgage loans, loaded with SSIS and reported through SSRS and Power BI. Loan, borrower, property and financial data become reports on loan volume, borrower demographics, loan amounts and overall loan performance.

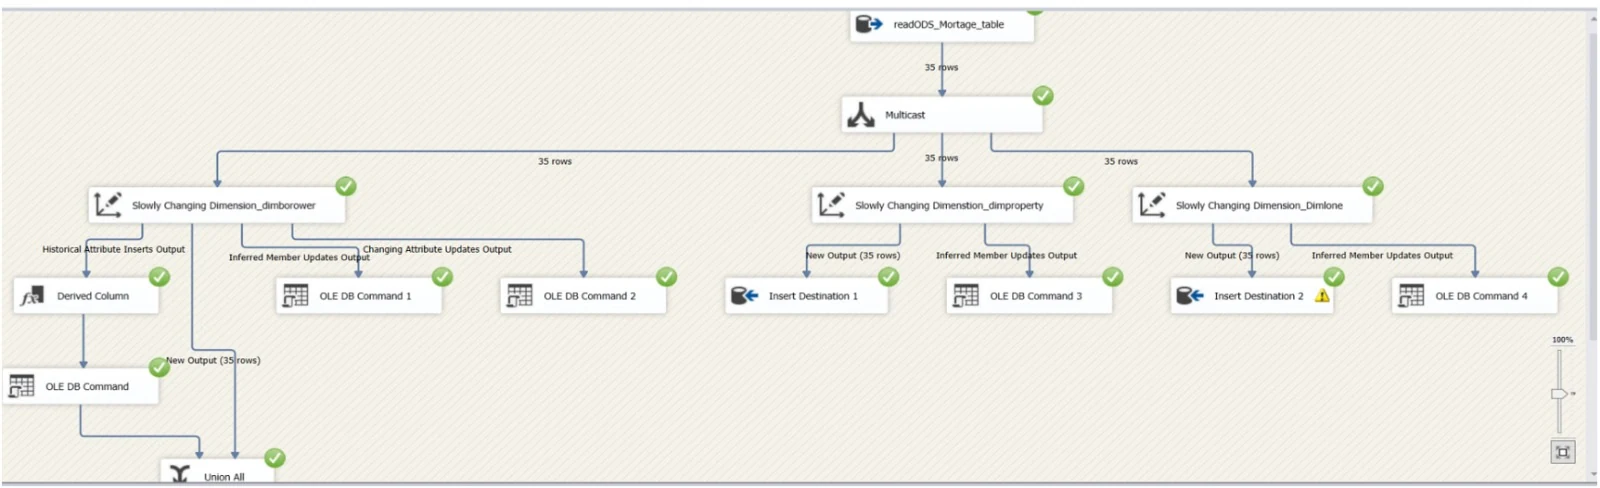
Dimensions loaded with SCD logic
3
Gauges against a prior baseline
3
Report parameters
5

Counted from the SSIS package and SSRS report shown here.

Challenge

Building a reliable mortgage data warehouse while handling ETL errors, surrogate-key relationships, and historical changes in borrower, property, and loan data.

Solution

Developed an SSIS ETL pipeline with Slowly Changing Dimensions, loaded the dimensional warehouse, and connected the resulting data model to SSRS and Power BI reports.

Tools, in the order data moves through them

Load

Move source data into a warehouse.

  • SQL
  • SQL Server
  • SSIS
  • ETL

Model

Design the tables and measures reports read from.

  • Data Modeling
  • Data Warehousing
  • Slowly Changing Dimensions
  • DAX

Report

Build the dashboards and paginated reports people use.

  • Power BI
  • SSRS
  • Excel
  • Dashboard Design

Also working with

Newer platform and AI tooling.

  • Microsoft Fabric
  • AI Features in Power BI

Certificates

  • Colaberry Certified badge, Data Analytics

    Colaberry Certified: Data Analytics

    Colaberry Inc. Digital badge.

  • Colaberry Certified badge, Power BI

    Colaberry Certified: Power BI

    Colaberry Inc. Digital badge.

  • Introduction to Data Analytics

    Colaberry Inc. Certificate of completion.

    View PDF
  • Power BI Data Visualization and Dashboard Tips, Tricks, and Techniques

    LinkedIn Learning, September 1, 2026. 3 hours 9 minutes.

  • Power BI: Integrating AI

    LinkedIn Learning, September 4, 2026. 3 hours 34 minutes.

Open to data analyst and BI roles.

Email or LinkedIn both work.

QR code that opens Kalish Shiferaw's LinkedIn profile

Scan to open my LinkedIn profile